R

ggstatsplot: When statistics meets plots

ggstatsplot: When statistics meets plots

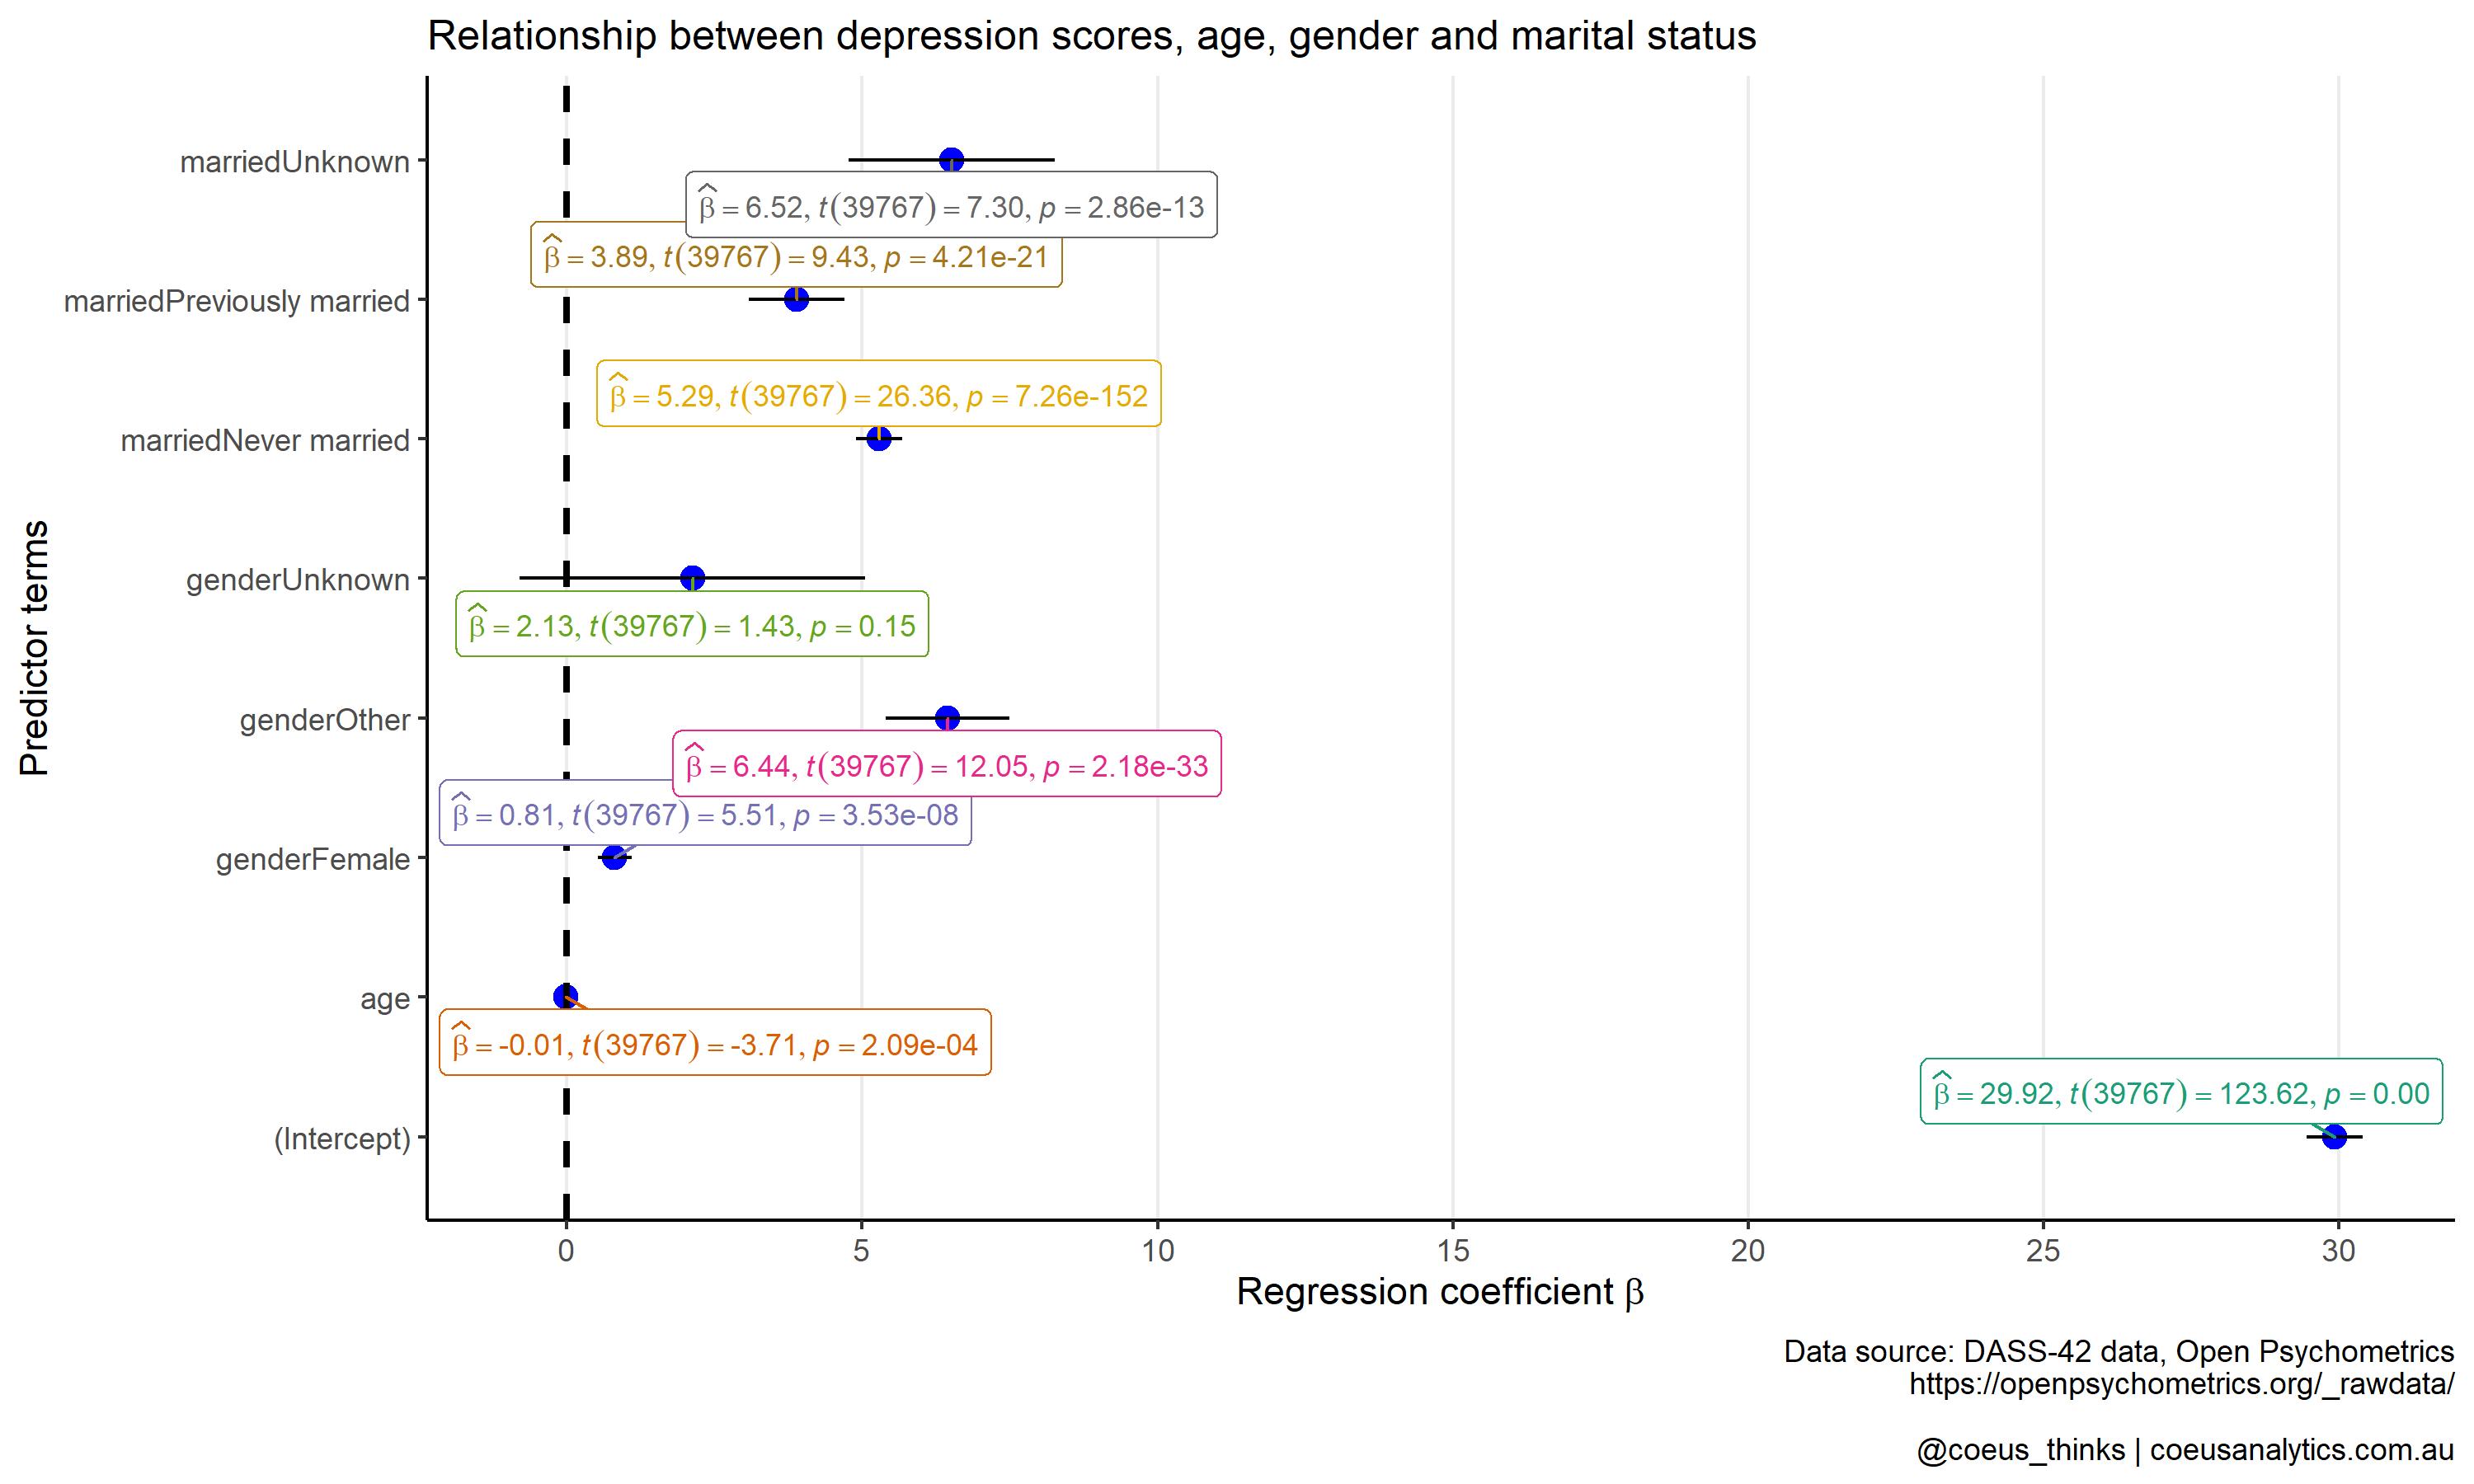
Visualisation in research is an important element in distilling the key points of technical information to make it understandable. I love the ggplot2 R package and have used it for research publications but found myself wondering if there were other R packages that could plot statistical results easily.

Continue reading
Why learn R in 2022: 5 reasons

Why learn R in 2022: 5 reasons

After a tumultuous year which was 2021, I thought I’d start the year with a bit of reflection in 2022. Eventually I decided that I’d write a seemingly generic post on reasons to start learning R except I wanted to unwrap what were my reasons on how exactly I ended up learning R to begin with.

Continue reading
Basic infographics in R

Basic infographics in R

“A picture is worth a thousand words.” R doesn’t need to be used only for purely data manipulation and analysis. I had used a number of data visualisation packages in R to help a client with suitable visuals.

Continue reading
R for business report reproducibility

R for business report reproducibility

While I have developed and published interactive dashboards on my website, I started thinking about the practicalities of creating dashboards for business reporting only. It occurred to me that, yes, large-scale reporting tools such as Tableau and Power BI that are amazing at producing self-service dashboards but organisations still rely on conventional reporting methods through the means of creating documents presenting findings from analyses.

Continue reading