
After a tumultuous year which was 2021, I thought I’d start the year with a bit of reflection in 2022. Eventually I decided that I’d write a seemingly generic post on reasons to start learning R except I wanted to unwrap what were my reasons on how exactly I ended up learning R to begin with.
My history of learning R
I swear this isn’t a grandiose post! I’m writing about my learning history with R to convey how a person who was not indoctrinated into any technical domain found so many benefits in taking up R.
Like most, I found myself using Excel extensively early in my career having managed contact centres and working in business analysis / process improvement. This was predominantly with clients who demanded slide decks with tables and numbers. Excel is an excellent tool and for the most part - it helped me produce relatively clean and engaging visuals. I moved into a senior role soon enough and found myself surrounded by and inundated with Excel workbooks used as reports everywhere. I am definitely not anti-Excel; far from it. However, I looked at the labour-intensive manually produced reports and naturally thought - “C’mon, there must be a better way?!”. I’m a pragmatist though: not everything can be automated but where there’s the opportunity - one should try.
This then led me to my self-taught journey with R. Perhaps it was a lucky Google search but I ended up dabbling in R. Figuring out what exactly is an R script and began to writing a basic script to import data files that were exported into a specific folder. Success - that removed the need to copy and paste the data from an Excel workbook into a Word document. I soon learned how to summarise / aggregate the data in a very short amount of code using the awesome dplyr package. For example, summarising student enrolments into a course by year and grouping it by student characteristics.
# this small part calculated number of student enrolments per year!
[student_dataset] %>%
  group_by(year, commencement_status) %>%
  summarise(student_enrolments = sum(enrolments))
Great. The R script helped me with the data analysis component but I didn’t want to manually take the results and paste it into a Word document for reporting purposes. This is where R Markdown changed my world. Yes, a bit dramatic but it really made a difference. The R Markdown document allowed me to reproduce the same report with almost a click of a button when I need to produce the analysis at a different time point with a new data set.
That’s enough of my history of starting to learn R. Here are some reasons I think it is worth learning R.
R is used to create beautiful data visualisations
The renowned ggplot2 R package is one of the attractive tools on offer for using R programming. The ggplot2 package alone could be enough to entice a new user to start their R learning journey. This tool is based on the grammar of graphics by Hadley Wickham which provides a structure for describing the components of a plot developed using ggplot2. Think of an artist painting a chart/plot on a canvas.
There are a host of extensions that enable deeper customisation of graphical layers, e.g. gganimate (for animating plots), plotly (for interactive plots), ggstatsplot (an incredible package for producing beautiful plots from statistical results). High quality graphics can be built using these R packages and can be assets when presenting key information to stakeholders in organisations.
For many professionals, communicating meaning by an appropriate visual using data is an important part of their job. Using the ggplot2 R package provides professionals an ability to create elegant plots with highly customisable aesthetics. The need to tweak visuals is vital especially for individuals needing to display complex data into a digestible visual to convey a specific message.
The below is only a mini example of writing code using ggplot2 to produce a simple data visualisation.
# monthly birth registrations in Victoria, Australia
ggplot(data = vic_births,
       aes(x = month_year, y = births_registered)) +
  geom_line() +
  geom_point() +
  theme_bw() +
  xlab("Month and Year") +
  ylab("Birth Registrations") +
  scale_x_datetime(date_labels = "%b %Y", date_breaks = "1 month") +
  annotate("rect", xmin = as_datetime("2021-10-01"), xmax = as_datetime("2022-01-01"),
           ymin = -Inf, ymax = Inf, fill = "blue", alpha = 0.25) +
  geom_vline(xintercept = as_datetime("2021-10-01"), colour = "darkblue", linetype = "dashed") +
  geom_vline(xintercept = as_datetime("2022-01-01"), colour = "darkblue", linetype = "dashed") +
  theme(axis.text.x = element_text(angle = 90, vjust = 0.5)) +
  labs(title = "Monthly birth registrations in Victoria, Australia",
       subtitle = "Slight increase in births observed after last lockdown in Oct 2021",
       caption = "Data Source: Births, Deaths and Marriages Victoria
       https://www.bdm.vic.gov.au/research-and-family-history/research-and-data-services/birth-statistics/births-registered-per-month
       Blue shaded area represents period after latest lockdown for Victoria

       @coeus_thinks")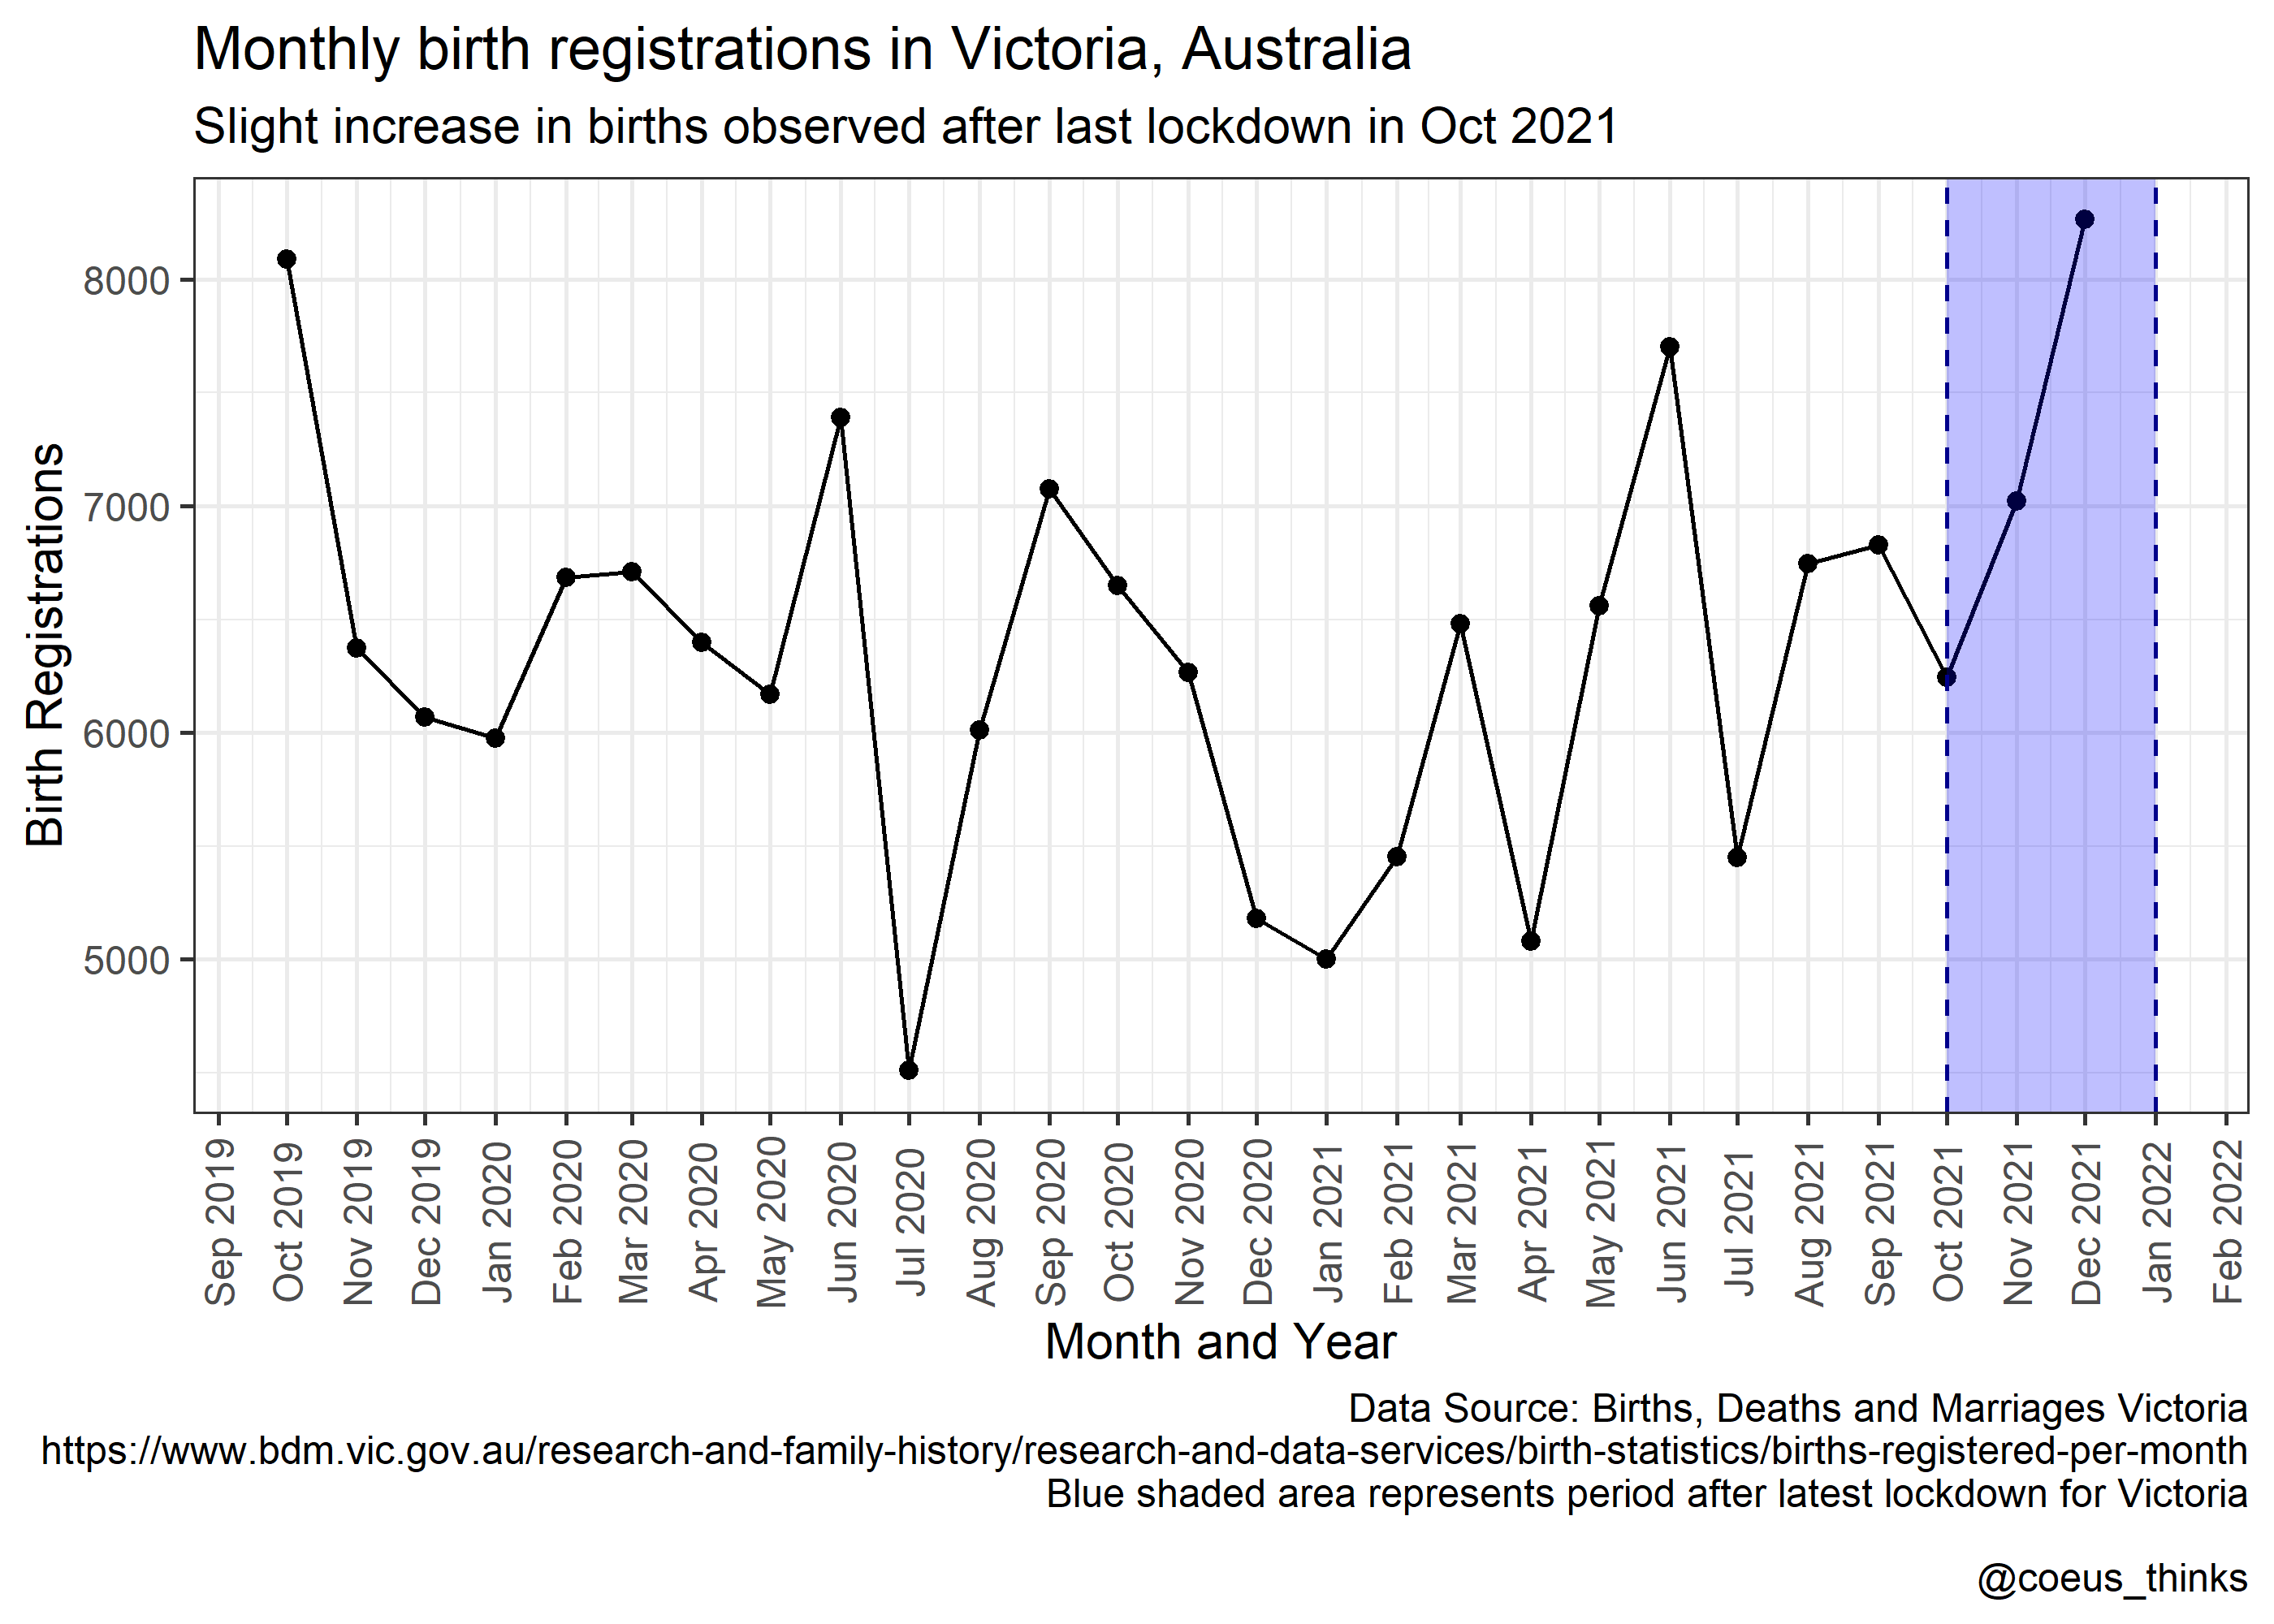
R is accessible by everyone
There are references to “open source” when we search for the rationale on using R. Sure - it’s free but what are the implications of that?
This offers everyone the choice to use R regardless of what profession you are in. Python and R are both open-source programming languages but R arguably might reduce the steepness of the learning curve with the release of the tidyverse suite of tools. These contain functions that are not syntactically complicated and the use of verbs resonates with most people on how you run certain commands.
There is no cost to start your R journey. Other commercial products for undertaking data transformations and statistical tests can be associated with substantial costs. There are over 18,000 R packages available in the Comprehensive R Archive Network (CRAN) which centralises all the open source R packages. These R packages serve a wide array of activities ranging from data wrangling to machine learning activities.
The dplyr R package which is part of the tidyverse suite of tools is a gift to those wanting to start learning R as it provides a chain of actions. One line of code below takes (1) a dataset; then (2) provides you the column names; and then (3) counts how many column names there are.
You don’t need to fall into an abyss of advanced code to run basic data analysis activity.
R is highly applicable for businesses
If you do a quick search about R programming, you will find a significant number of results for data science and research. This is expected as R was originally framed as a language specifically designed for undertaking statistical analysis. The modern day application of R is now wider than ever.
Here is why it is applicable for businesses and business professionals who may not necessarily have coding experience:
- Businesses continue to require insights to be drawn by people for which R can efficiently produce and act as a suitable alternative to other tools.
- While commercial products are powerful (e.g. Power BI; I love Tableau!), not all data can be meaningfully consolidated into a dashboard. Managers and directors still require potentially periodic reports to be created for them with commentary.
- Reproducibility, not for stakeholders, but for other work colleagues as part of knowledge transfer is very important in businesses too and R scripts allow for multiple team members to re-run the same code and work together.
- Advanced analytics can be undertaken via R programming for various use cases across the business.
You hear a lot about reproducible research but what about reproducible reporting? I elaborate on this reproducible reporting in my tutorial on R for business report reproducibility. Here’s a snippet below of how a sample report can be produced by rendering an R Markdown document which then creates a Word document with all the required analysis and content:
Lastly, businesses can utilise R to develop web-based Shiny apps which are interactive applications that don’t solely report on data but allow users to even run their own analysis. These Shiny apps are highly customisable by modifying CSS themes and utilising JavaScript. These front ends can be valuable by serving users with a self-service capability for running their own analysis rather than relying on turnaround times from other teams.
R has a wide range of data analytics capability
There’s a misconception that R can only be used by hardcore data scientists but this isn’t exactly true. The breadth of R packages allows for a range of analytical activities to be undertaken enabling a wider user base to use R.
For high-level data analysis and running statistical operations, there are a number of packages that can assist in basic to intermediate data analytics work:
knitrandrmarkdown. Packages to help you programmatically produce reports.dplyr. A popular package that makes it easy to manipulate and summarise data.gtsummary. For those wanting to produce polished tables with statistical results, this package can summarise regression models and render a nice tables containing the results.leaflet. R can also help with geospatial mapping.ggplot2. The powerful R package for visualising data.rstatix. A package that helps with performing basis statistical tests which plays nicely withdplyr.
Thankfully, for advanced analytics and machine learning, there are many tools available to the R user. The following a only a small sample!
caretpackage. Contains functions for training regression and classification models.h2o. Comprehensive machine learning package.xgboost. Another popular machine learning package.fable. Time series forecasting!
In short, there is generally suitable tools in R to assist a variety of professionals who may be on very different trajectories with regards to their data analytics experience.
R is an extension of what we know conceptually
The packages available in R resemble many of the activities that most users have undertake in Excel. From pivot tables to summarising results to saving end results as another file format - R functions can cover most of these operations. It is about taking the familiar and doing this programmatically.
For example, equivalent actions in Excel can be run in R:
- In Excel, users can open Excel data files. In R, users can import existing xlsx data files using the
readrpackage. - In Excel, users can run calculations in a new columns. In R, users can modify existing columns and create new columns using the
dplyrpackage. - In Excel, users can produce charts. In R, users can create data visualisations using the
ggplot2package. - In Excel, users can save the final workbook. In R, users can export the final data set(s) using the
writexlpackage.
Final thoughts
R is a great programming language. That said, no programming language is perfect but R arguably has a easier learning curve compared to other languages. It depends on your use cases.
If you’re interested in learning the fundamentals of R, please take a look at our Everyday R: Foundations in R course on offer. The course is aimed to help professionals understand the use of R with real world data sets to run basic data transformations and data analysis activities.