
While I have developed and published interactive dashboards on my website, I started thinking about the practicalities of creating dashboards for business reporting only. It occurred to me that, yes, large-scale reporting tools such as Tableau and Power BI that are amazing at producing self-service dashboards but organisations still rely on conventional reporting methods through the means of creating documents presenting findings from analyses. Realistically, not all reporting in organisations are automated via the use of these business intelligence (BI) tools. For example, I will still need to write up analyses that will be sent to executives and managers in documents.
The modern day business professional will still need to rely on traditional reporting such as creating documents containing key findings and recommendations that cannot be feasibly replaced by a dashboard. There are some specific use cases where dashboards are suitable for a user group(s) that can happily interrogate the data for themselves. This is where R Markdown is a favourite tool of mine for automating reports in the form of documents and designing polished reports in a business context.
Business report reproducibility using R Markdown
R is renowned for its reproducibility due to using the same code to manage and automate processes for analysing and communicating data. Many organisations especially those that do not have the budget (e.g. non-profit) to roll out commercial reporting products such as Power BI or Tableau. There may also not be a business case to justify such costs. It then becomes even more imperative to have low-/no-cost tools (R is open-source, by the way!) that can efficiently generate reports for a variety of stakeholders.
The term reproducibility seems to be associated with research publications and dashboard design and development but can be equally applied to the reporting activities that business professionals undertake to provide information to stakeholders. R Markdown can immensely help with building high quality publications for business reporting. R Markdown is essentially a framework and a file format that allows users to produce (not limted to) HTML documents and Word documents. Not only that but it can be integrated in a workflow that picks up your assembled R code for generating analyses, figures, tables etc to incorporate them seamlessly into your chosen document. This is nifty when your audience prefers additional commentary to accompany your findings in your report.
To illustrate, here are some of the cases that I’ve used R Markdown for business purposes:
Preparing a consultancy findings pack in Microsoft Word
Producing evaluation report for an intervention in Microsoft Word
Standardising a PowerPoint presentation containing key metrics for executives
Rendering a HTML-based interactive report on analysis of specific cohorts
In all these cases, these reports were compiled with (almost) the press of a button. But … we need to remember that it’s simply another tool for producing reports. You might be more comfortable with the conventional approach of building plots in Excel, copying and pasting those plots into a Word document and then finalising it for your audience. That’s perfectly fine. R Markdown (with the right workflow) can be powerful in automating reports for the right situation. It can provide consistency of layouts and structures, improved efficiency in producing standard reports and allow you to work in the one environment.
A quick guide to R Markdown for business reporting
It sounds daunting to programmatically create a document but once you have put in the work - you can reuse it to produce subsequent reports without needing to significantly modify it. This is a quick guide on preparing a workflow for producing a simple business report that incorporates your summaries and plots that have been produced in another R syntax file.
Microsoft Word documents are used ubiquitously for business reporting in organisations and I figured that any business professional would want to potentially semi-automate such a process for producing business documents.
Creating your .Rmd file
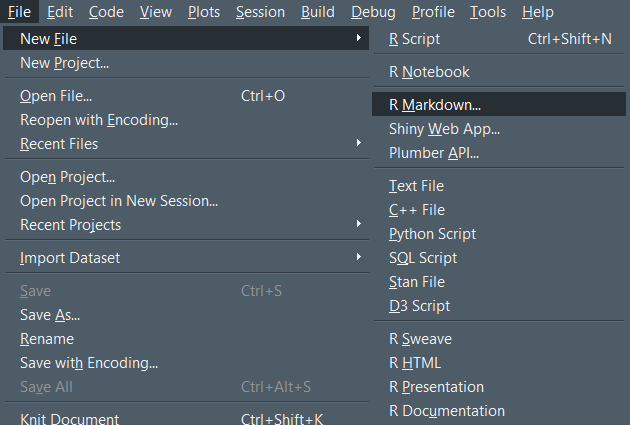
To create the .Rmd file, you will need the rmarkdown package installed first. Once installed, there will be an option in RStudio to create a standard .Rmd file. Click on File > New File > R Markdown to generate a new .Rmd file.
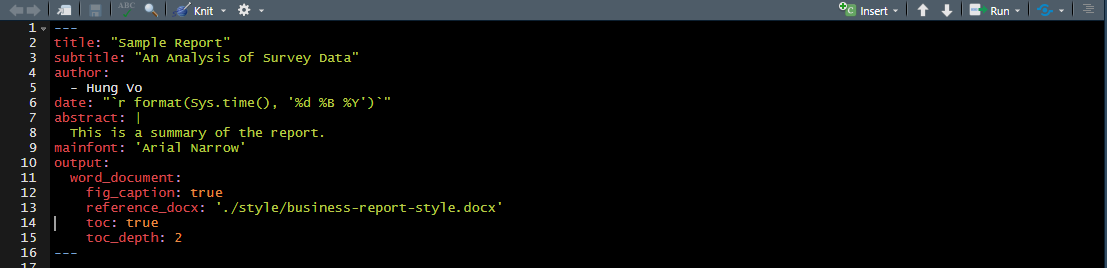
Setting up your YAML header
Configuring the YAML header will produce the first page of your Microsoft Word document. You can set up which document format you will be rendering the document as. In this case, we’re going to prepare a **Word document* as per the output: word_document option.
A few other pointers here:
Use the current date so you don’t need to manually type it in
The abstract is used as almost a nice summary for the front page of your business report
Definitely use the
reference_docxoption to source a Word document template to apply organisational styles, if any
We have essentially now set up the look for our front page. Pretty straight forward.
Notice that the reference_docx refers to an external Word document that contains all the pre-determined styles for paragraphs, headings, captions etc. I have also added a artificial heading level (Level 6) to act as a page break in the Word document. There isn’t an officially endorsed method of changing Word document page orientation from portrait to landscape and vice versa using the rmarkdown package. However, I personally use the developmental officedown package to modify page orientation on the fly. I would suggest taking a look at it if you have a requirement to switch between the page orientations.
Suitable business report headings
The next step we want to do is to add suitable business report headings into the document. Headings can be easily specified in your R Markdown file by adding a # preceding the heading content. For example, for a Level 1 heading - we can call it # Executive Summary. The template, so far, will look like this:
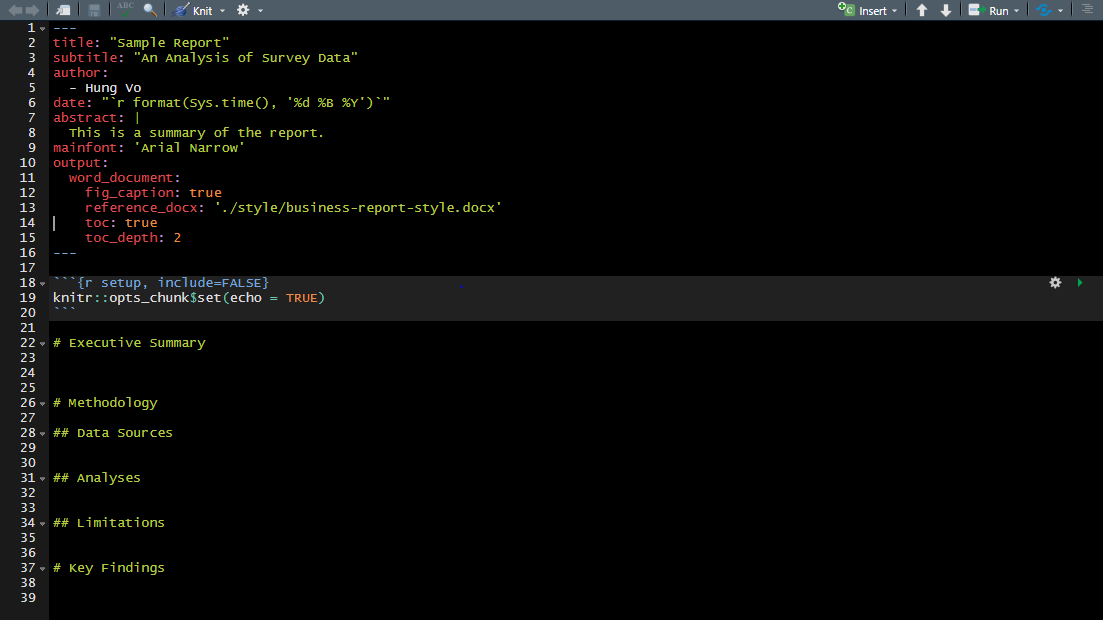
The structure has now been set up for the business report. You may wish to use other headings. The benefit of preparing appropriate headings is that you can reuse the same .Rmd template for other key analyses and production of relevant business documents.
Code chunks and rendering your analyses
The great thing about R Markdown are the code chunks. You can organise your code into chunks which R Markdown will run and incorporate the results into your final document. To illustrate, we’ll pretend that we’re running some analysis on the 2016 City of Casey Short Survey responses for which the data is publicly available to understand the level of engagement that the community wants from its council.
The first code chunk can be used to read in the required data set for which subsequent code chunks will use to populate results. Let’s clean up the data set a bit, i.e. a few transformations, recoding variables etc.
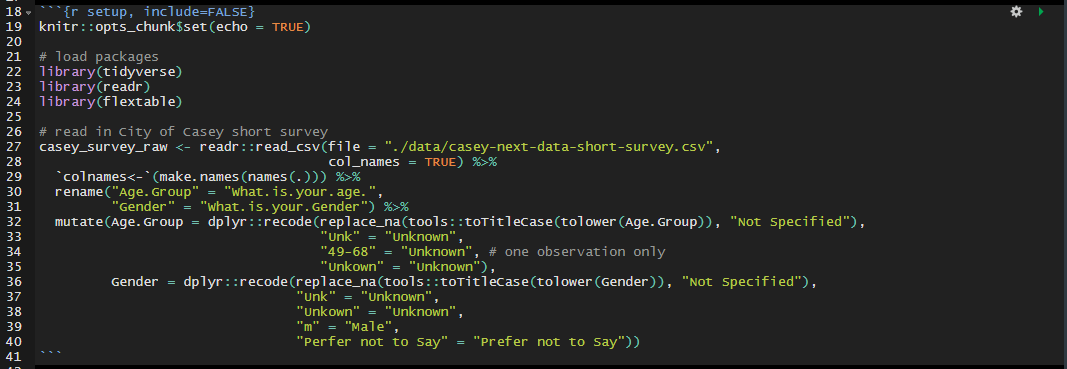
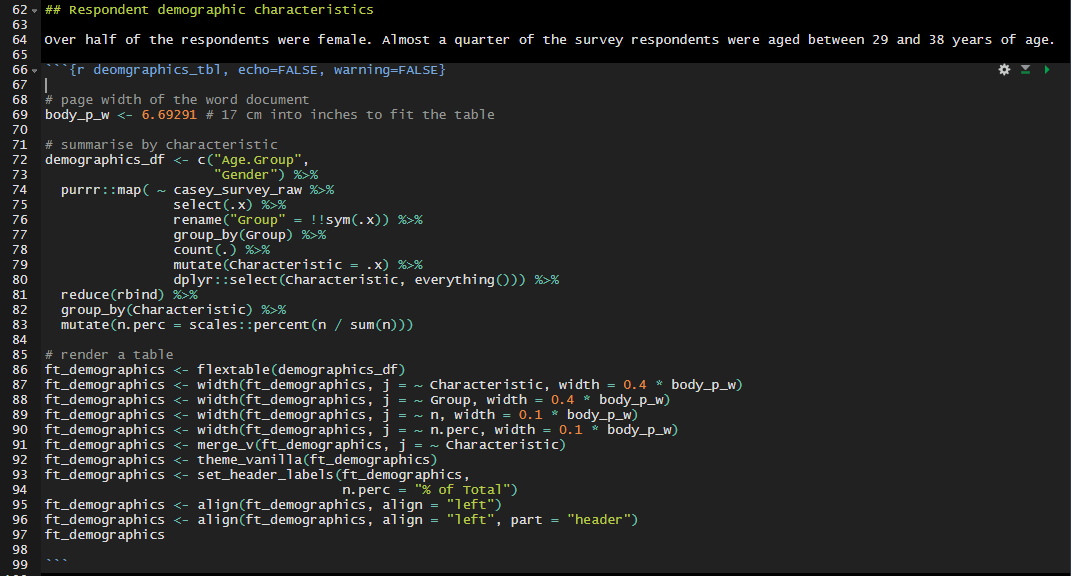
Next, we can jump to the second code chunk in the Key Findings section and perform our first descriptive statistics tabl simply to understand the demographic characteristics of the survey respondents. Since we’re using a table, the flextable package becomes our friend here with its powerful formatting features and configurations. There is a lot going on in the code chunk but essentially, the flextable allows us to:
Set the column width based on a percentage of your word document’s page width
Merging a specific column rather than repeating values in each row
Setting a theme for your flextable
Some basic commentary is then added above the code chunk to convey what emerges from the results in the table. Simple.
At this stage, it’ll be worthwhile to see how the document looks. In RStudio, you knit your .Rmd file to render it into your chosen document format. You can either click on the Knit button in the menu for the .Rmd file or press CTRL + SHIFT + k to render the .Rmd document. The file will render a Word document incorporating your predetermined style document, the headings that you have specified and present the formatted table with the frequencies by demographic characteristics.
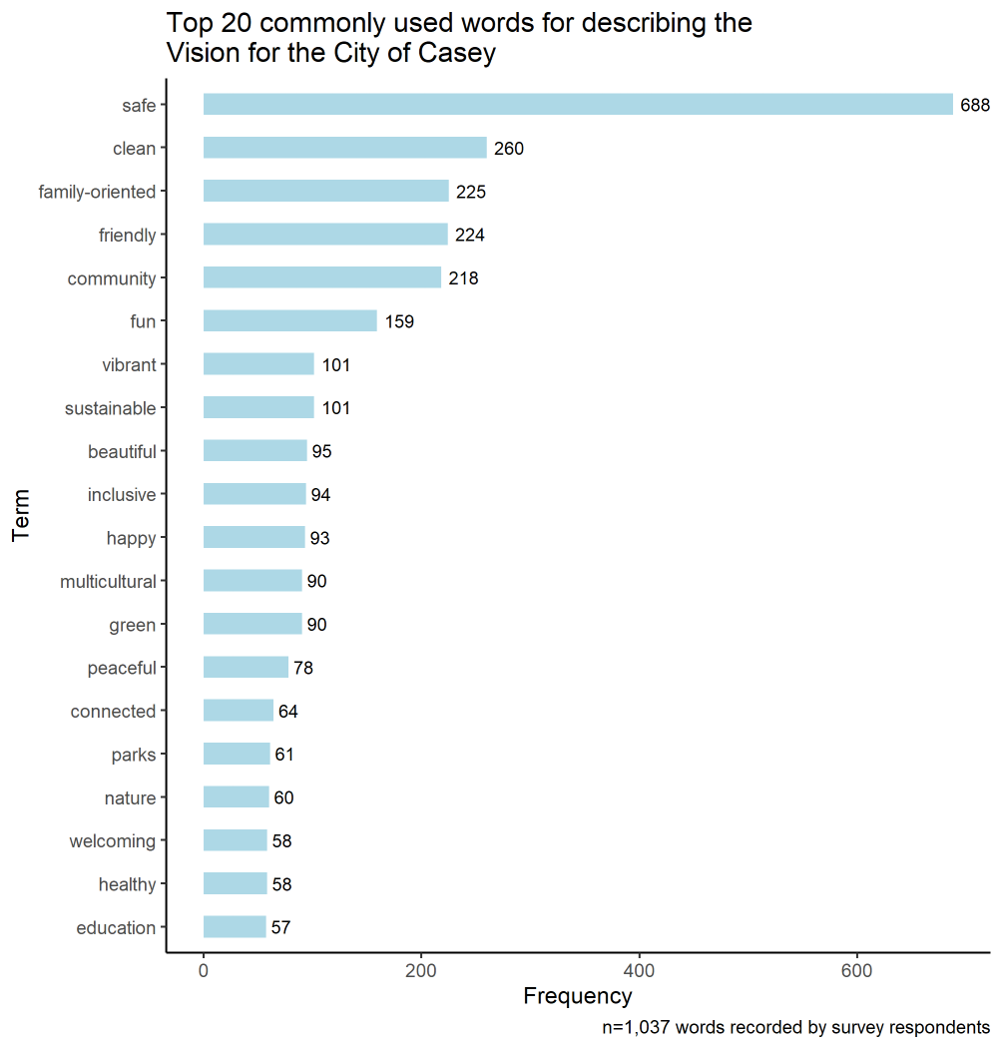
Finally, adding in a plot is straight forward in R Markdown. Insert another code chunk, set the figure options (such as width and height) and include the code for your plot. In this case, I’ve added a ggplot() describing the Top 20 term frequencies to the question “What three words would you use to describe your Vision for the City of Casey?”. Some succinct commentary is added in for illustration.
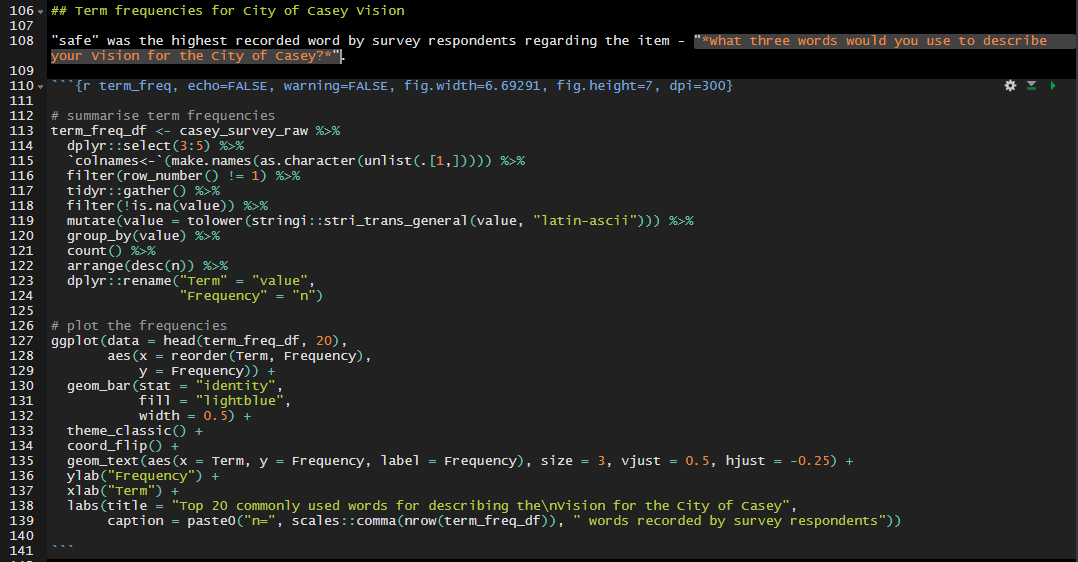
… this produces the following bar chart showing term frequencies:
The final document
Let’s now knit/render the whole document. A word document will be produced with the following:
A front page based on the YAML header configuration
The headings you decide to incorporate
Formatting for your Word document with the predefined style reference document that you created
Formatted tables and plots rendered right from the specified data source
I have shared the sample business report syntax in my GitHub repository - feel free to take a look: GitHub repository
Key Takeaways
The need for static business reporting still exists in organisations. R Markdown is one tool to potentially automate standard processes while customising various aspects of your document. The framework is flexible enough to produce not only Word documents but PDFs, PowerPoint presentations and HTML documents. The tool has helped me standardised some reporting processes in my own experience but ultimately it will depend on your own situation.
I would recommend settling on style reference documents and developing themes for objects such as flextable and ggplot2 to make the process more reproducible. In the end, you can utilise the same template for running your own reports and analyses minimising the need to manually update the document. Check out the GitHub repository and let me know if you have any other ideas about creating high quality business report documents. Feel free to get in touch with me if you have any suggestions.